
Winter Color Trial Report
North Carolina State University
Raleigh, North Carolina
2016–2017
Mark Weathington
Director
Bernadette Clark
Agricultural Research Technician
Department of Horticultural Science
JC Raulston Arboretum
Table of Contents
General Introductory Notes and Acknowledgements
Understanding Our Data
Climate Graphs
Variance
Plant Material Sources
Top 10
Best of Breed
Leaders of
the Pack
Early
Season Leaders of the Pack
Late
Season Leaders of the Pack
Cultivar Series
Summaries
Weekly Ratings
Top Ten
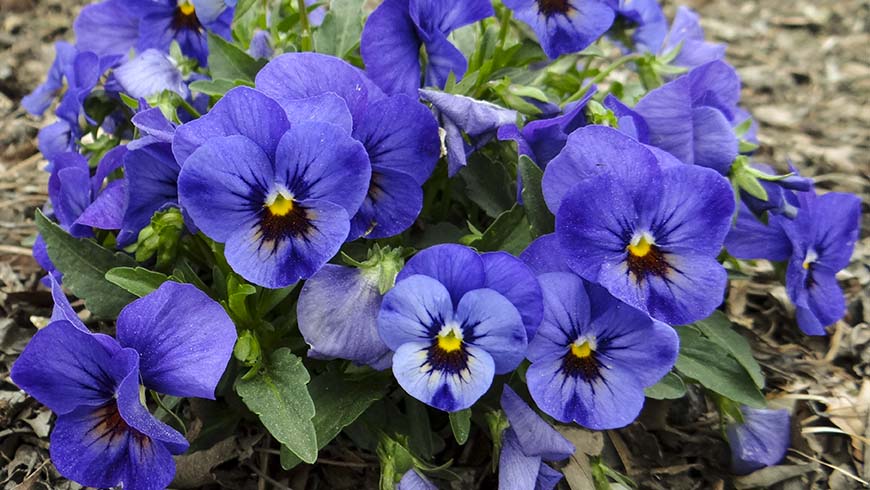
Viola cornuta (Sorbet™ XP Blue Jeans)
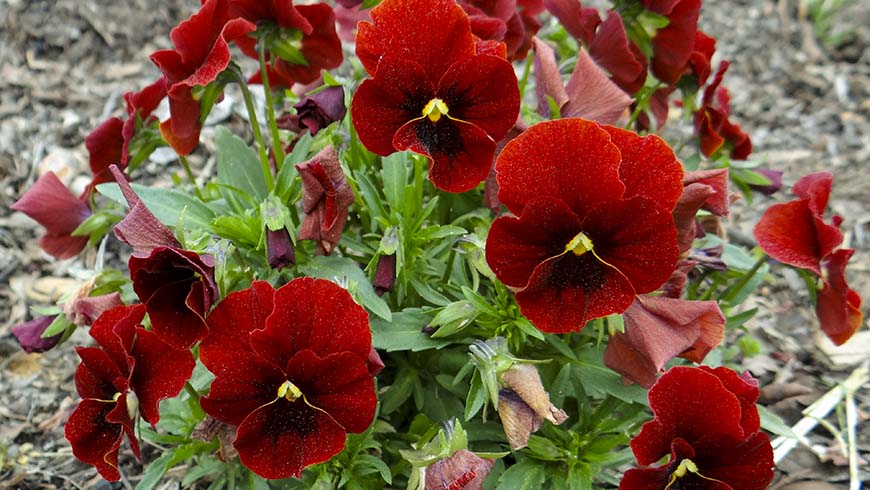
Viola cornuta 'PAS1171800' (Sorbet™ XP Red Blotch)
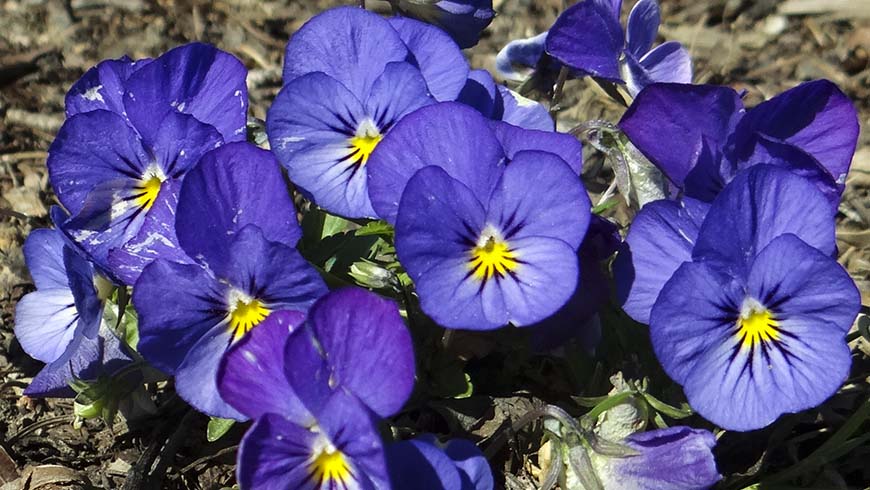
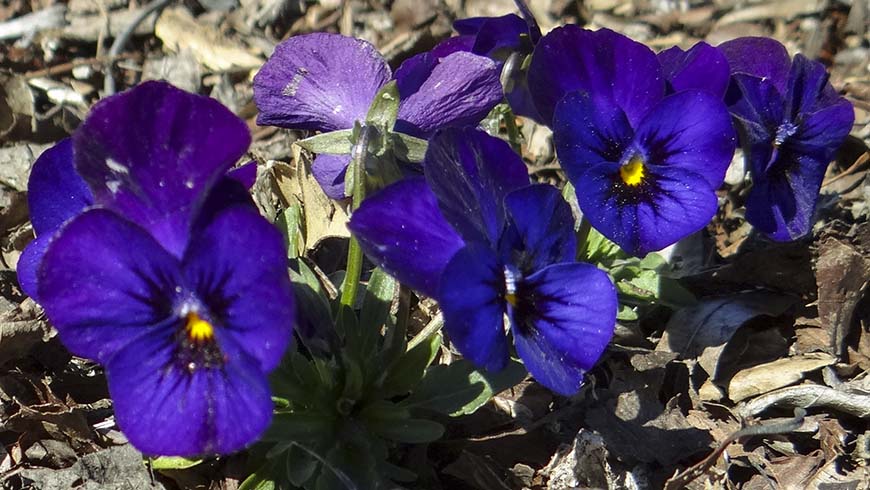
Viola cornuta 'PAS786651' (Sorbet™ XP True Blue)
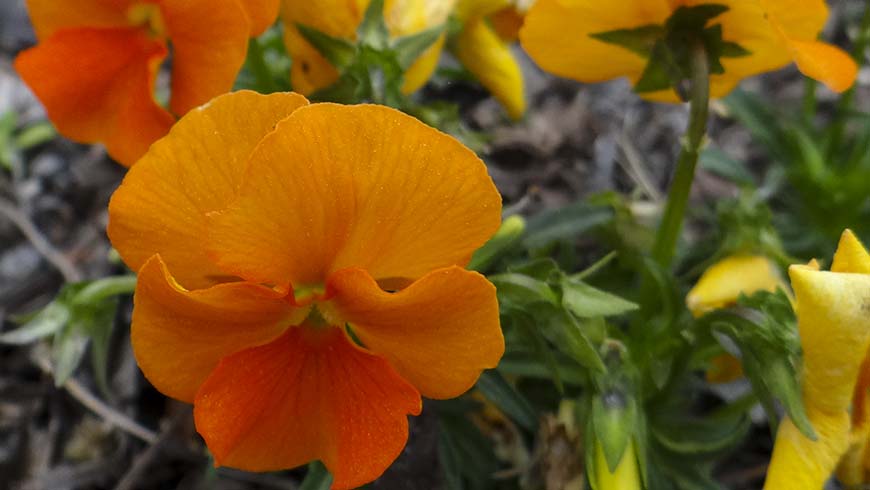
Viola cornuta 'PAS1171798' (Sorbet™ XP Deep Orange)
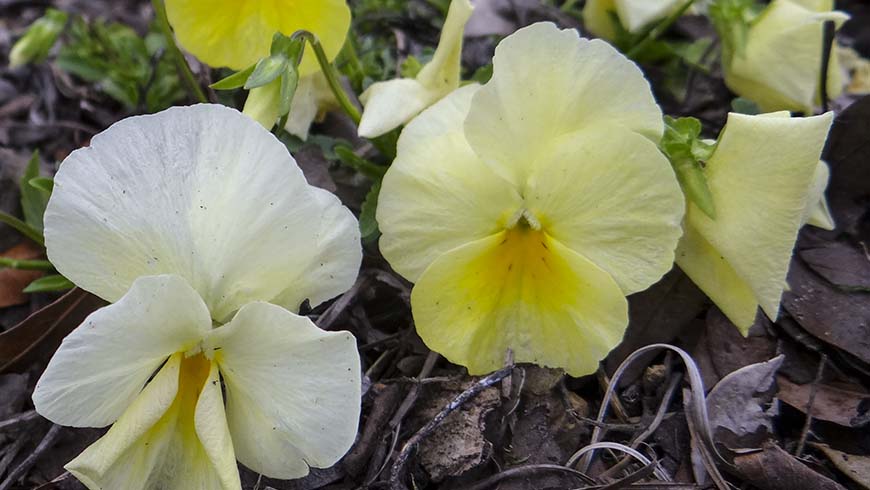
Viola ×wittrockiana (Cool Wave® Lemon Improved)

Viola ×wittrockiana 'PAS1122753' (Matrix® Yellow Improved)
Viola cornuta 'PAS733574' (Sorbet™ XP Yellow Violet Jump Up)
Viola cornuta 'PAS786645' (Sorbet™ XP Blue Blotch Improved)
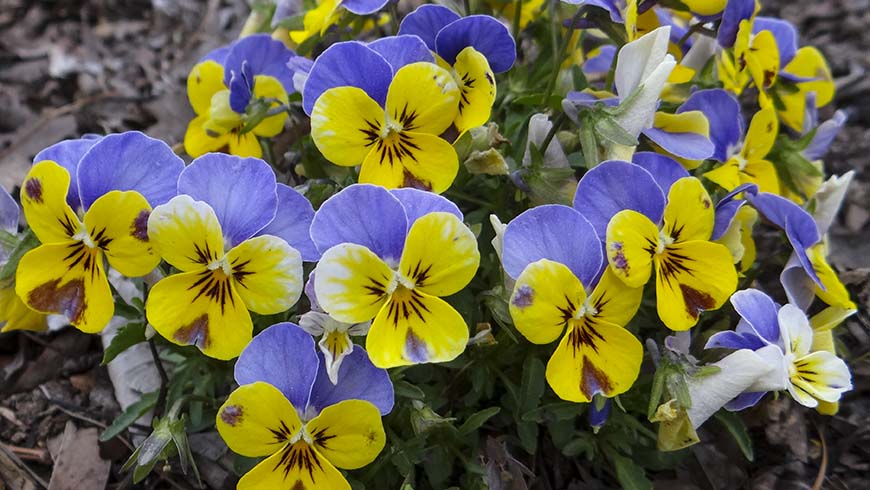
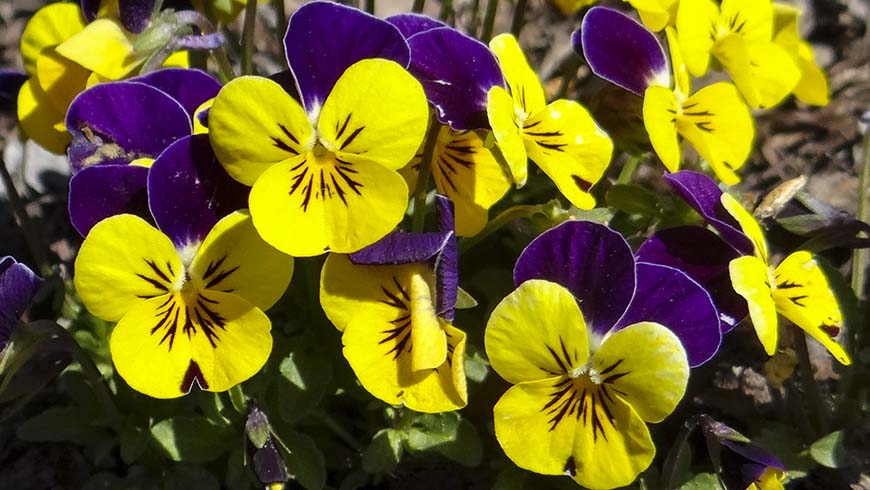
Viola ×wittrockiana (Sorbet™ Yellow Blue Jump Up)
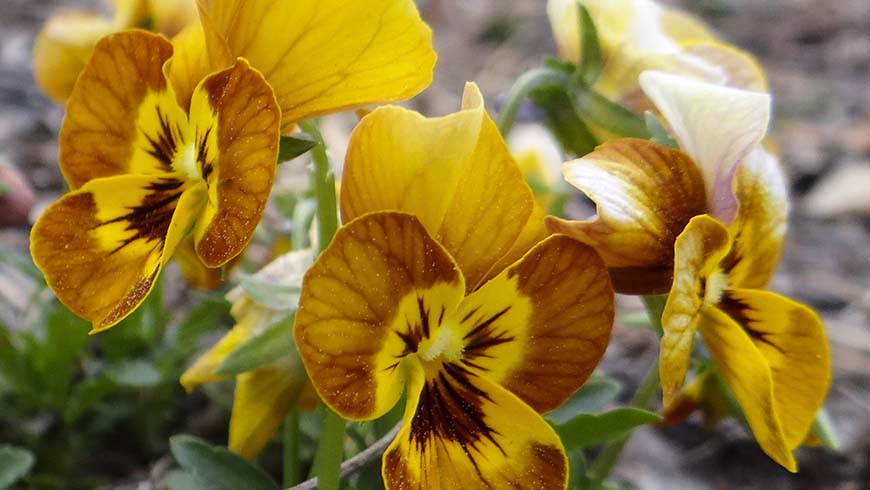
Viola ×wittrockiana 'PAS1122567' (Sorbet™ Honeybee)
General Introductory Notes and Acknowledgements
The Trial Gardens for seasonal color plant materials are located at NC State University within the JC Raulston Arboretum (JCRA) in Raleigh. The JCRA is a 10.5 acre site administered by the Department of Horticultural Science and located on 35° 47'N latitude, longitude 78° 42' W, with an elevation of 400 feet.
Plants to be entered into our trials are received in a variety of ways. Almost all of the winter entries were germinated from seeds whith the few remainder originating as established cell plugs. Virtually all are grown within controlled greenhouse environments prior to placement in protected outdoor structures for hardening off. They were planted into their permanent trial bed locations on October 11, 2016. The predominant plant spacing in the trials was 18 inches × 24 inches (in-row × between-row spacing). Seven plants of each entry were used to evaluate landscape performance and ratings were taken weekly.
Acknowledgements
We thank the following for their support of material donations this season:
- SunGro Horticulture, 3723 Hogshead Road, Apopka, FL 32702
We are especially thankful to the volunteers of the JC Raulston Arboretum who assisted in planting and maintaining the beds. We couldn't have done it without you!
Understanding Our Data
Number of Weeks in Flower
This is recorded as the total number of weeks in flower throughout the entire season. It should give you an idea of whether or not a plant is best used for the whole season or as a "fill-in" for special displays. Obviously, those species grown for foliage interest alone, e.g. ornamental kale, may score poorly in this column and should not be rejected based on this value alone!
Weekly Ratings
Plants were given a visual rating weekly by the same person beginning October 25, 2016, (two weeks after planting) through March 30, 2017. The overall rating was based on plant performance and appearance, including floriferousness, plant size and shape, and freedom from insect and disease problems. The rating scale ranged from 1 (very poor) to 5 (excellent) with 0.5 unit increments possible; a 0 rating indicated that all plants of the cultivar trial died.
Summaries of Weekly Ratings
The first statistic that readers see is likely the "all season average." This value represents overall performance for the entire season. However, realizing that there are many species/cultivars which may do better in one part of the growing season versus another, we also provide an "early season average" and "late season average" for each entry. The former is the average of the first half of the evaluation period and the latter represents the end of the season. This information may be useful in planning short term plantings with high impact as well as for studying temperature preferences, life cycle changes, and/or the impact of photoperiod on plant performance. The "number of weeks rated above 3" gives you an idea of how consistently throughout the season an entry is an exemplary performer.
The Lists You'll Find In This Report
• "The Top 10" - this list shows the species/cultivars with the top ten "All Season Averages." These were our best overall performers. When the list exceeds ten, there were ties.
• "Leaders
of the Pack" – lists all species/cultivars with an "All
Season Average" of 3.0 or better. We consider this the arbitrary cutoff
rating for a "significant performer" in Raleigh. This list shows
all your best choices for planting, listed by plant name.
• "Leaders of the Pack – Early Season" – this shows entries with "Early Season Averages" of 3.0 or better based on the first half of the evaluations. This group may prefer warmer temperatures or only have a relatively short ornamental life, and might not show up on the "Leaders of the Pack" list above.
• "Leaders
of the Pack – Late Season" – this shows entries with
"Late Season Averages" of 3.0 or better based on the end of the
season evaluations. They may prefer warm temperatures or flower as daylengths
start to lengthen, again sometimes precluding them from inclusion on the overall
"Leaders of the Pack" list.
• "Best of Breed" – shows the best performing cultivars in each species.
• "Summary by Series" – groups the information for cultivar series where appropriate. This can be a quick reference for related cultivars as well as a handy tool to judge the general performance of an entire series offered by a breeder/company.
• "Weekly Ratings" – evaluation given for each entry on a weekly basis.
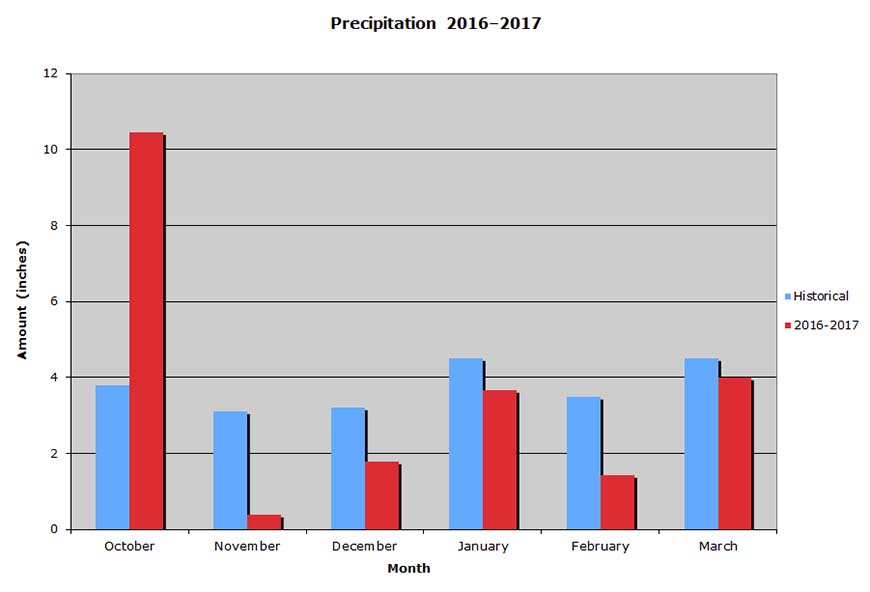
The Average Monthly Temperature and Precipitation for the Winter 2016–2017 Trials
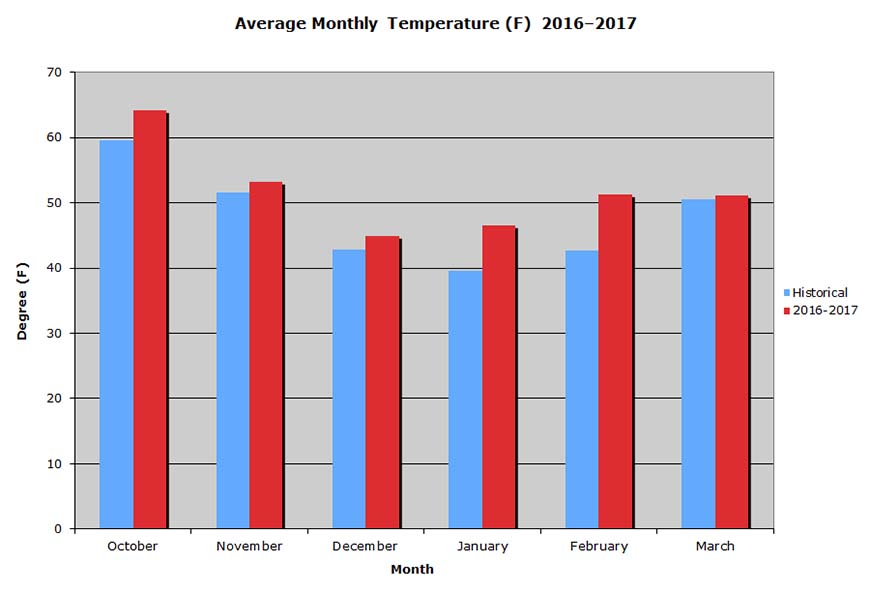
The 2016-2017 winter season was one long roller coaster ride. We experienced low temperatures in the teens to high temperatures in the low 80s. The entire season was made up of rapid cycles of warm temperatures followed by freezing temperatures. There was no gradual transition from cold to warm to cold at any time.
November temperatures were only slightly on the warm side. The first freezing event occurred on November 13 with a low temperature of 28°F.
Our "meteorological winter" (December–February) had well above normal temperatures with February breaking historical records. In January, we had seven straight days of below freezing night temperatures with daytime highs in the 30s and 40s. Our coldest night, 11°F, was on January 9. February goes down in the weather books as the warmest in 130 years. We had three days of temperatures 80F or higher! In March, we had eight back-to-back days of sub-freezing temperatures with daytime highs in the 40s and 50s. Our March average temperatures were lower than those in February.
The rain total for October was 10.45"! We planted after Hurricane Matthew devastated our state. Only 1.5 inches of October's total occured after the planting. November was a very dry month (0.39") making November 2016 the 9th driest since 1887. The reminder of the season was on the dry side, with January and March closest to the norm.
Variance
Variance: The Best of Uniformity
Sometimes I think that the one number most often overlooked in our report is the variance. Go to the "Leaders of the Pack" data tables and look for its column. The term itself may be intimidating in light of its mystery, but need not be as it can be most informative. Simply put, the lower the variance, the most alike all plants are in the group evaluated, and hence the greater the uniformity. For so many in the commercial landscaping sector, they live and die by uniformity because appearance can be everything. So, by using a selected variance value of 0.1 as our very tough cut-off, we can really see which plants are setting the standard for superb uniformity.
Variance: All Over the Page
Whereas small variance values indicate excellent uniformity, the opposite can point out cultivars with a "mind of their own!" They are not necessarily a poor choice, just not ruler perfect. In this case, plants with variance values of 1.0 or more were highlighted for great differences observed during the season.
Seed and Plant Material Sources
Please get in touch with the company if you have specific questions regarding individual species and cultivars.
- PanAmerican Seed, 622 Town Road, West Chicago, IL 60185