
Summer Color Trials Report
North Carolina State University
Raleigh, North Carolina
2018
Mark Weathington
Director
Bernadette Clark
Agricultural Research Technician
Department of Horticultural Science
JC Raulston Arboretum
Table of Contents
- Top Performers
- General Introductory Notes and Acknowledgements
- Understanding Our Data
- Climate Graphs
- Variance
- Plant Material Sources
- Reports
- Top 10
- Best of Breed
- Leaders of the Pack
- Early Season Leaders of the Pack
- Late Season Leaders of the Pack
- Cultivar Series Summaries
- Weekly Ratings
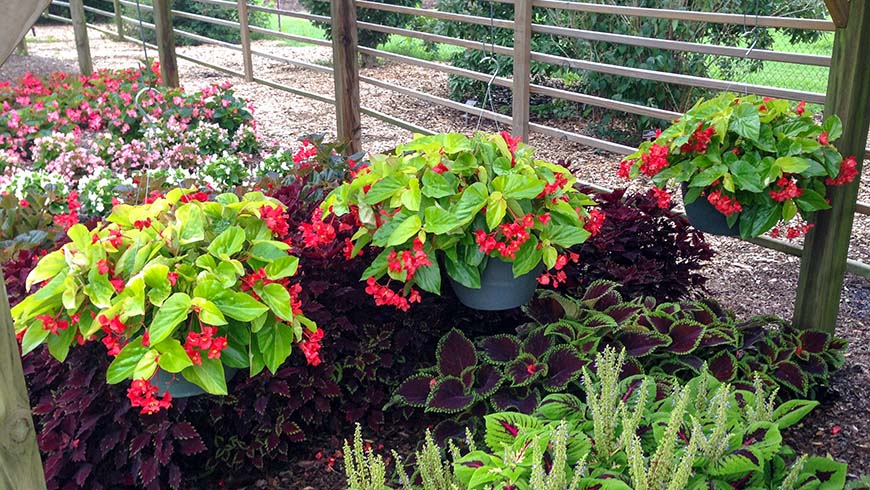
Top Performers
Beds
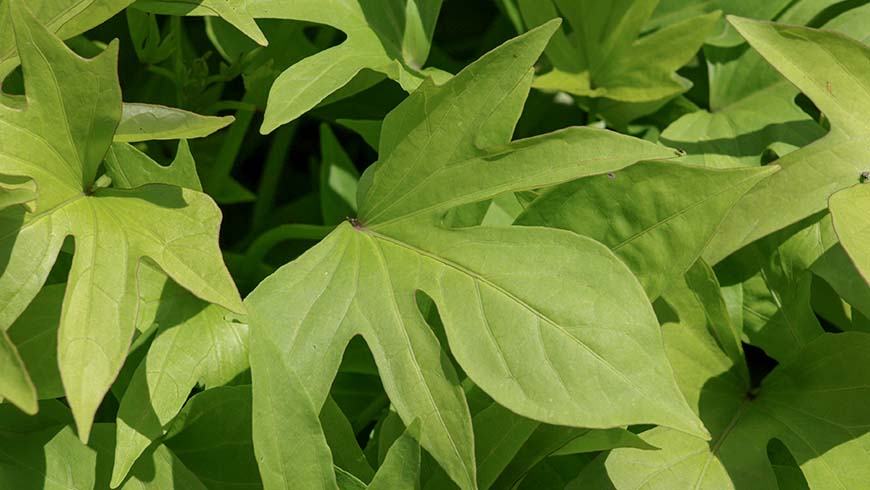
Ipomoea 'Sweet Caroline Kiwi'
sweet potato
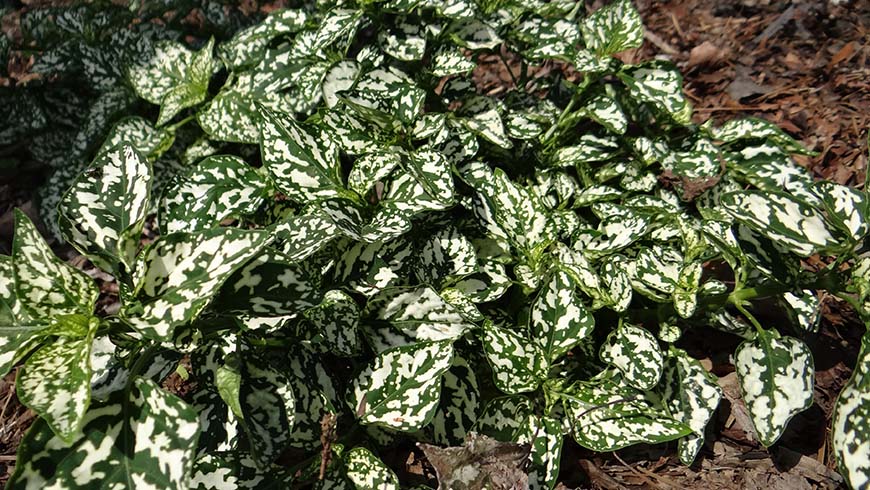
Hypoestes phyllostachya 'Hippo White'
polka dot plant
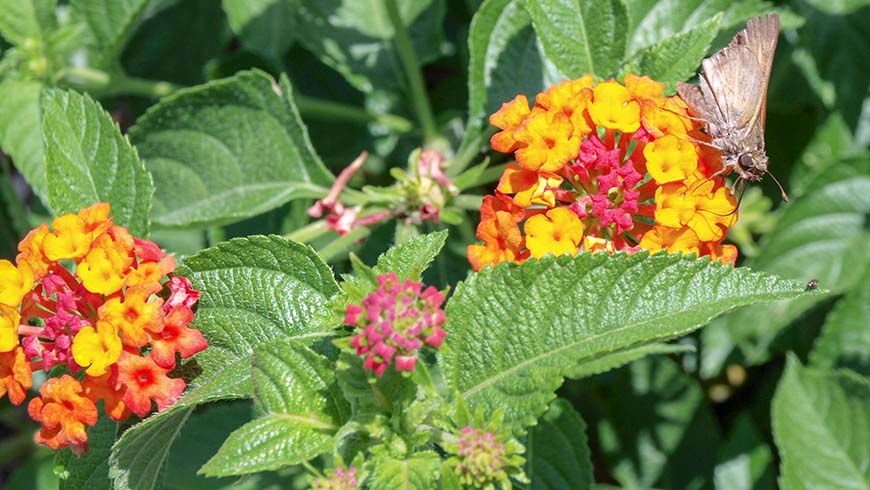
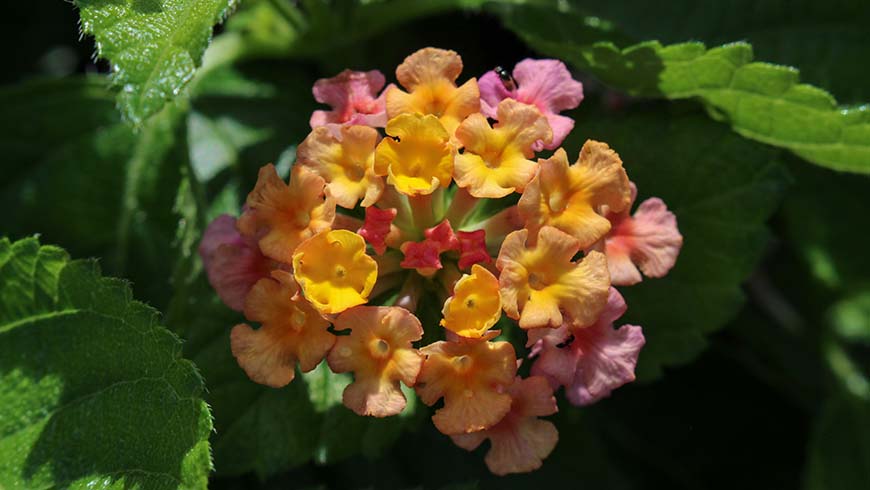
Lananta camara 'Luscious Citrus Blend Improved'
lantana
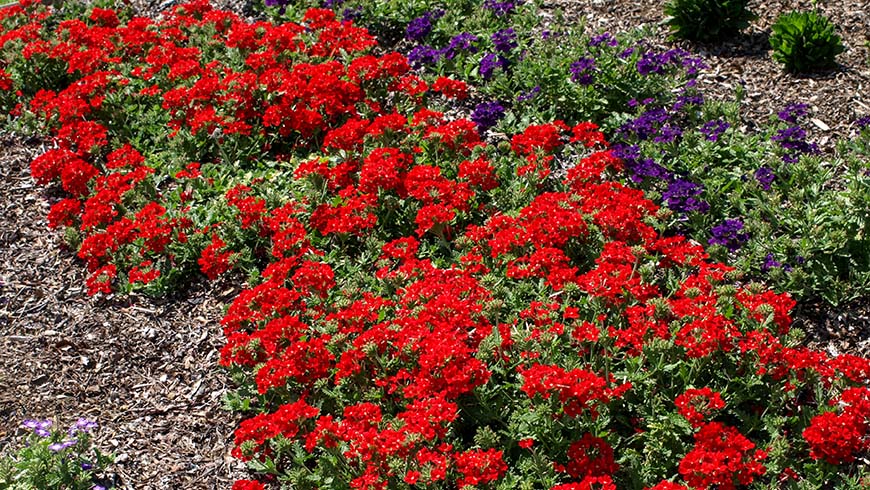
Verbena 'Superbena Scarlet Star'
verbena
Containers
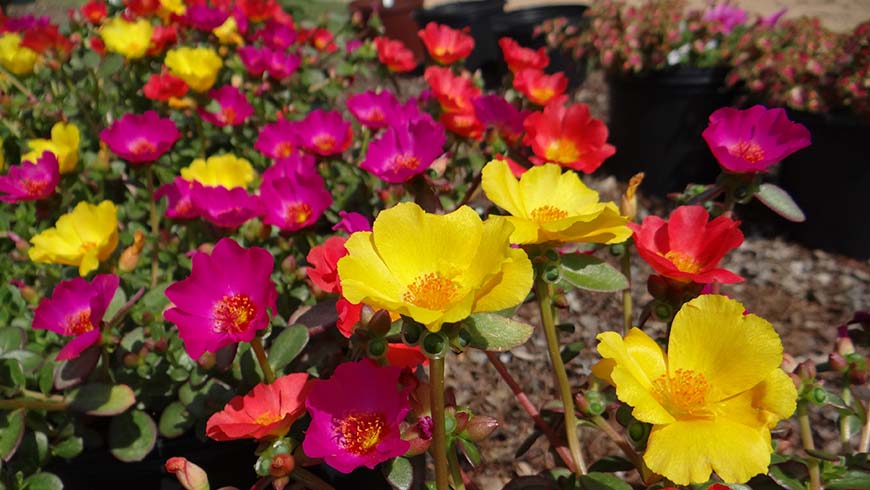
Portulaca
mixed planting of Cupcake Smarty Party moss rose
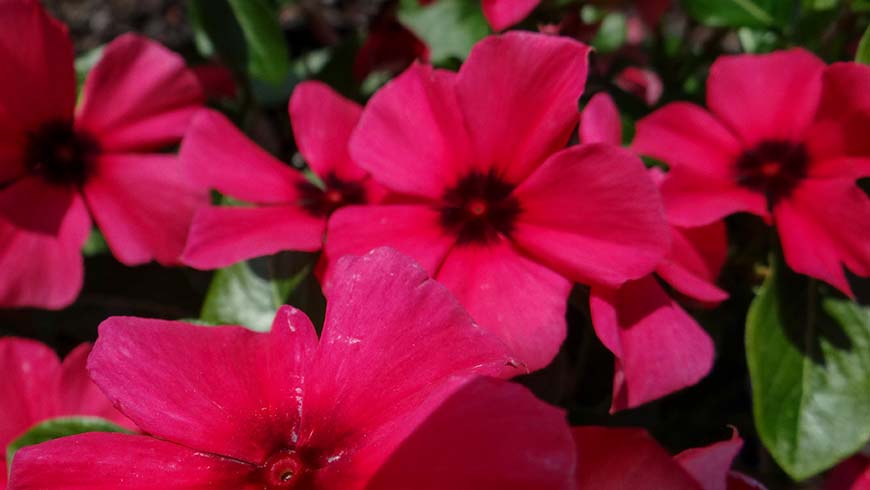
Catharanthus roseus 'Tattoo Raspberry'
periwinkle
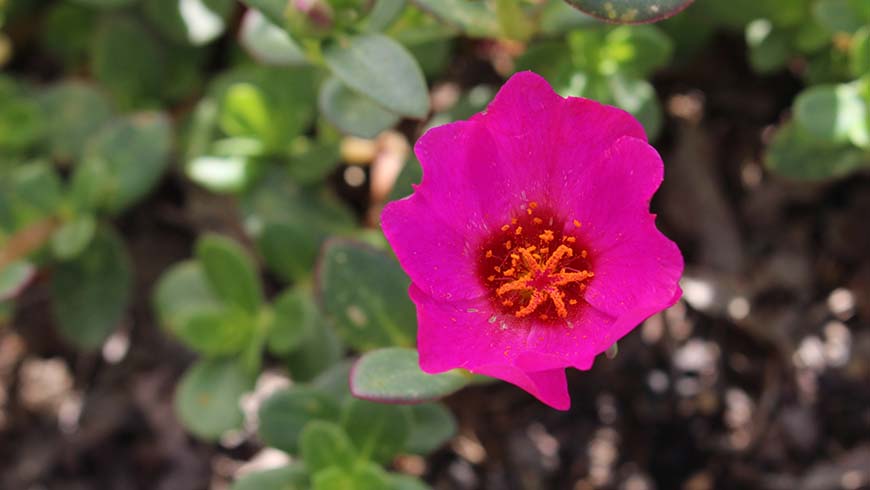
Portulaca 'Cupcake Upright Lavender'
upright moss rose
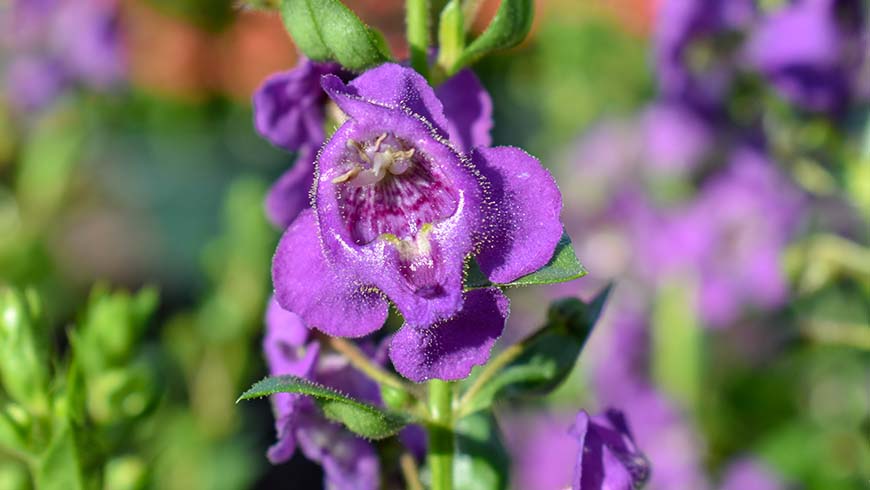
Angelonia angustifolia 'Angelface Cascade Blue'
angelonia
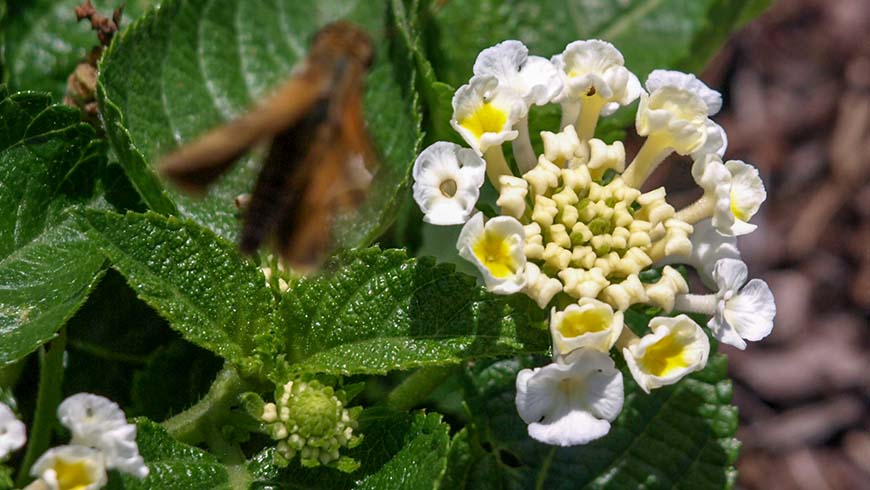
Lananta 'Havana Full Moon'
lantana
Lantana 'Havana Sunset'
lantana
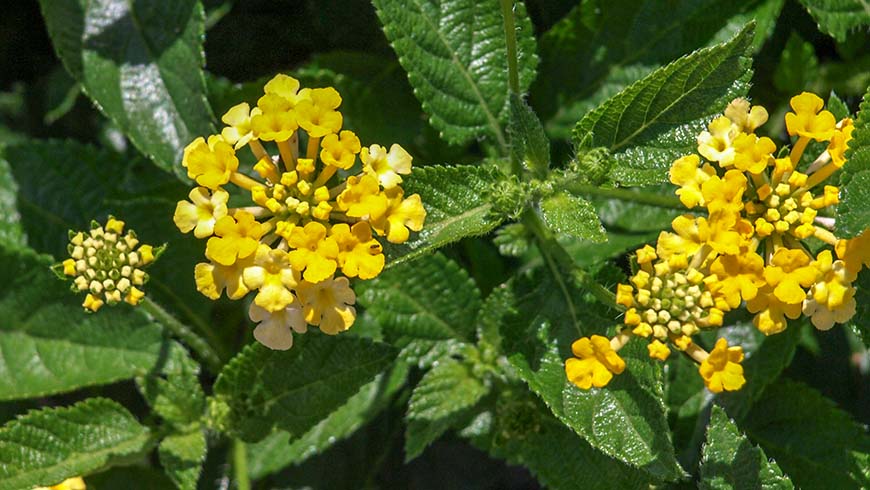
Lantana 'Havana Sunshine'
lantana
Hanging Baskets
Begonia 'Canary Wings'
begonia
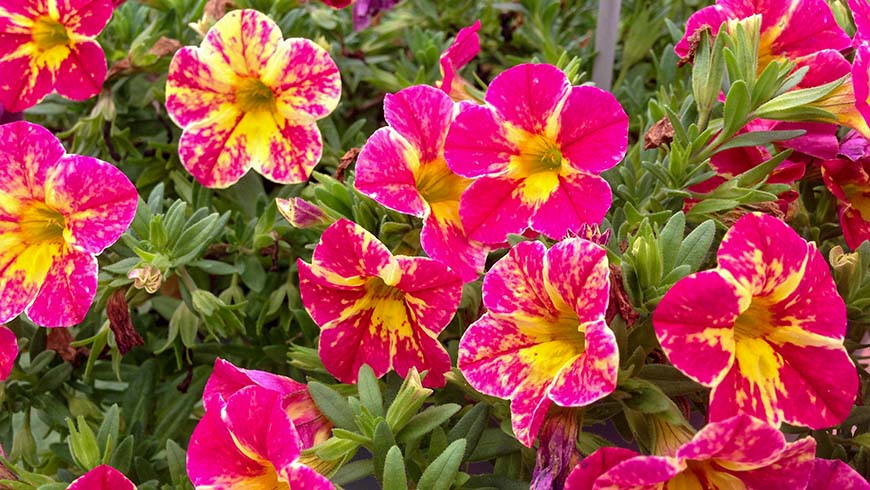
Calibrachoa 'Aloha Nani Tropicana''
calibroachoa
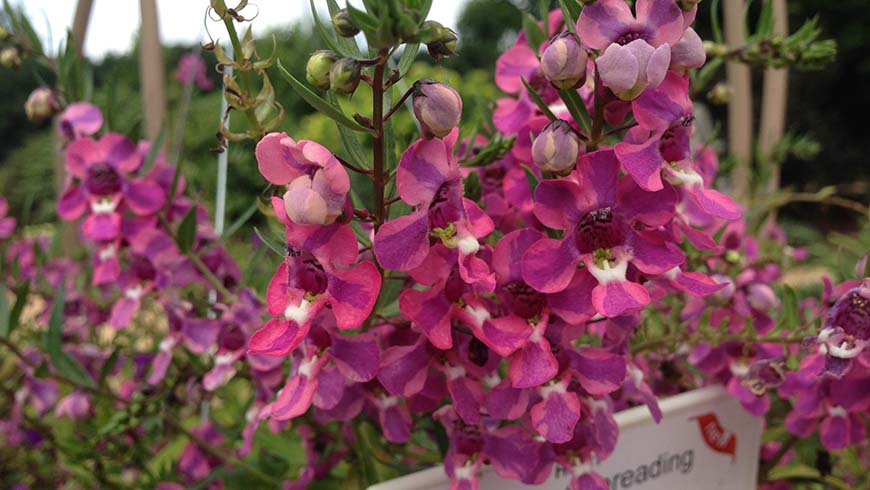
Angelonia angustifolia 'AngelMist Spreading Berry'
angelonia
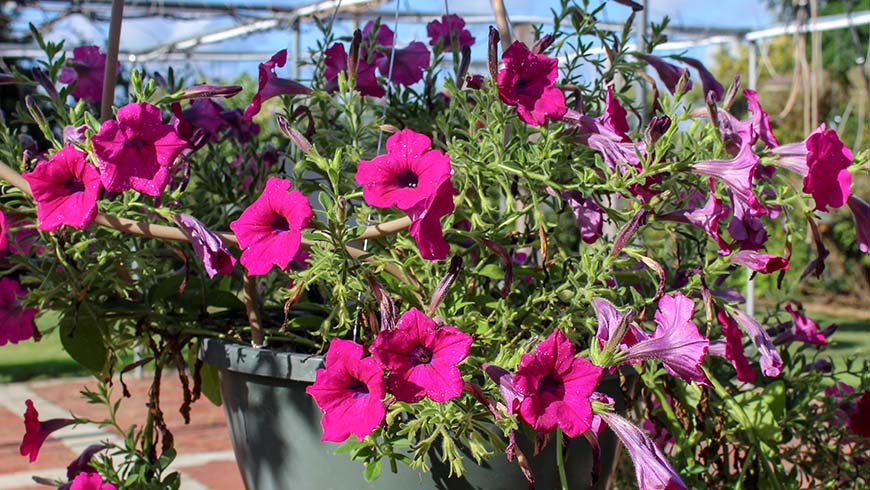
Petunia 'Opera Supreme Purple'
petunia
Petunia 'Peppy Burgundy Star 2019'
petunia
General Introductory Notes and Acknowledgements
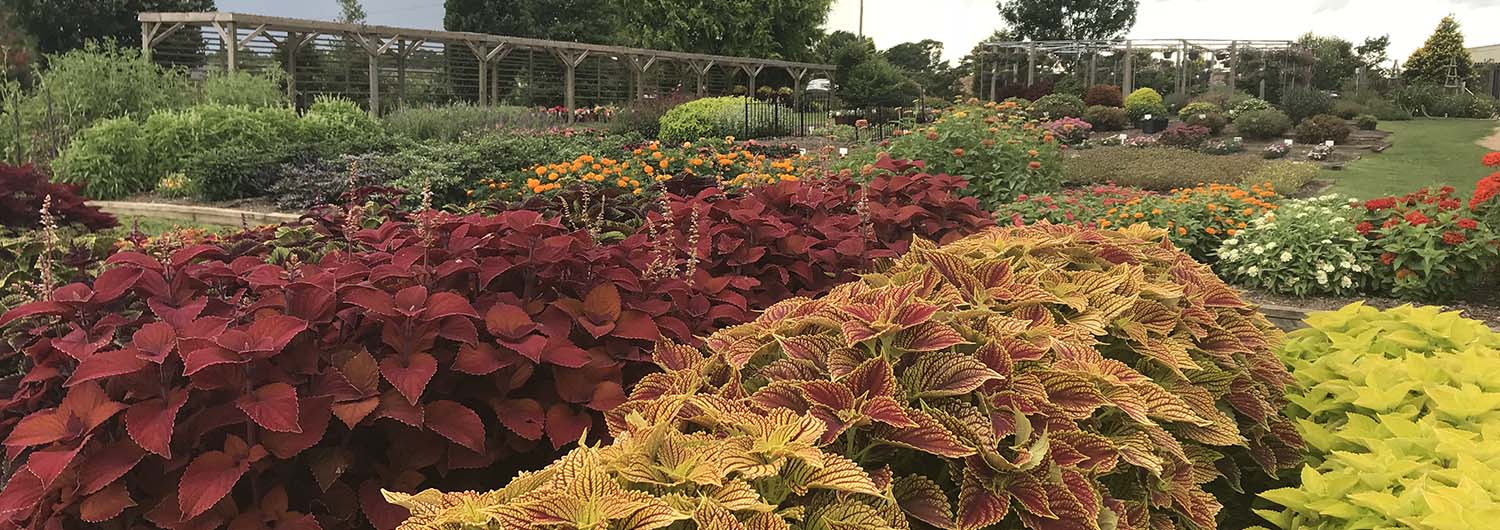
The Trial Gardens for seasonal color plant materials are located at NC State University within the JC Raulston Arboretum (JCRA) in Raleigh. The JCRA is a ten and a half acre site administered by the Department of Horticultural Science and located on 35° 47'N latitude, longitude 78° 42' W, with an elevation of 400'.
Plants to be entered into our trials are received in a variety of ways. About one third are germinated from seeds while the remainder originate as rooted cuttings or established cell plugs. Virtually all are grown within controlled greenhouse environments prior to placement in protected outdoor structures for hardening off. They were planted into their permanent trial bed locations on May 1, 2018. The predominant plant spacing in the bed trials was 18 inches × 24 inches (in-row × between-row spacing). Seven plants of each entry were used to evaluate landscape performance. Hanging baskets contained three plants and were replicated three times. Containers had one plant each and were replicated five times. All ratings were taken weekly.
Acknowledgements
We thank the following for their support:
- BASF, 26 Davis Drive, Research Triangle Park, NC 27709
- Sun Gro Horticulture, 4731 Homestead Place, Matthews, NC 28104
We are especially thankful to the departmental staff and the volunteers of the JC Raulston Arboretum who assisted in transplanting and maintaining the annual beds throughout the growing season … we couldn't have done it without you all!
Understanding Our Data
Number of Weeks in Flower
This is recorded as the total number of weeks in flower throughout the entire season. It should give you an idea of whether or not a plant is best used for the whole season or as a "fill-in" for special displays. Obviously, those species grown for foliage interest alone, e.g. Acalypha, may score poorly in this column and should not be rejected based on this value alone!
Weekly Ratings
Plants were given a visual rating weekly by the same person beginning May 25, 2018 (about three weeks after planting) through September 30, 2018. The overall rating was based on plant performance and appearance, including floriferousness, plant size and shape, and freedom from insect and disease problems. The rating scale ranged from 1 (very poor) to 5 (excellent) with 0.5 unit increments possible; a 0 rating indicated that all plants of the cultivar trial died.
The best way to really evaluate our trials is to come in person. The JCRA is open 365 days a year.
Summaries of Weekly Ratings
The first statistic that readers run to is likely the "all season average." This value represents overall performance for the entire summer season. However, realizing that there are many species/cultivars which may do better in one part of the growing season versus another, we also provide an "early season average" and "late season average" for each entry. The former is the average of the first half of the evaluation period and the latter represents the end of the season. This information may be useful in planning short term plantings with high impact as well as for studying temperature preferences, life cycle changes, and/or the impact of photoperiod on plant performance. The "number of weeks rated above 3" gives you an idea of how consistently throughout the season an entry is an exemplary performer.
The Lists You'll Find In This Report
We started presenting the data in three separate categories in 2012: beds, containers, and hanging baskets. This allows a truer, more equitable way of comparing the entries. Each category will have the individual breakout of data, just like before. For example, you will be able to view a Top 10 listing for beds, containers, and hanging baskets entries.
"The Top 10" (beds, containers, and hanging baskets) – this list shows the species/cultivars with the top ten "All Season Averages." These were our best overall performers. When the list exceeds ten, there were ties.
"Leaders of the Pack" (beds, containers, and hanging baskets) – lists all species/cultivars with an "All Season Average" of 3.5 or better. We consider this the arbitrary cutoff rating for a "significant performer" in Raleigh. This list shows all your best choices for planting, listed by plant name.
"Leaders of the Pack – Early Season" (beds, containers, and hanging baskets) – this shows entries with "Early Season Averages" of 3.5 or better based on the first half of the evaluation period. This group may prefer cooler temperatures or only have a relatively short ornamental life, and might not show up on the "Leaders of the Pack" list above.
"Leaders of the Pack – Late Season" (beds, containers, and hanging baskets) – this shows entries with "Late Season Averages" of 3.5 or better based on the end of the season evaluations. They may prefer very warm temperatures or flower as daylengths start to shorten, again sometimes precluding them from inclusion on the overall "Leaders of the Pack" list.
"Best of Breed" (beds, containers, and hanging baskets) – shows the best performing cultivars in each species.
"Summary by Series" (beds, containers, and hanging baskets) – groups the information for cultivar series where appropriate. This can be a quick reference for related cultivars as well as a handy tool to judge the general performance of an entire series offered by a breeder/company.
"Weekly Ratings" (beds, containers, and hanging baskets) – evaluation given for each entry on a weekly basis.
The Average Monthly Precipitation and Temperature for the Summer 2018 Trials
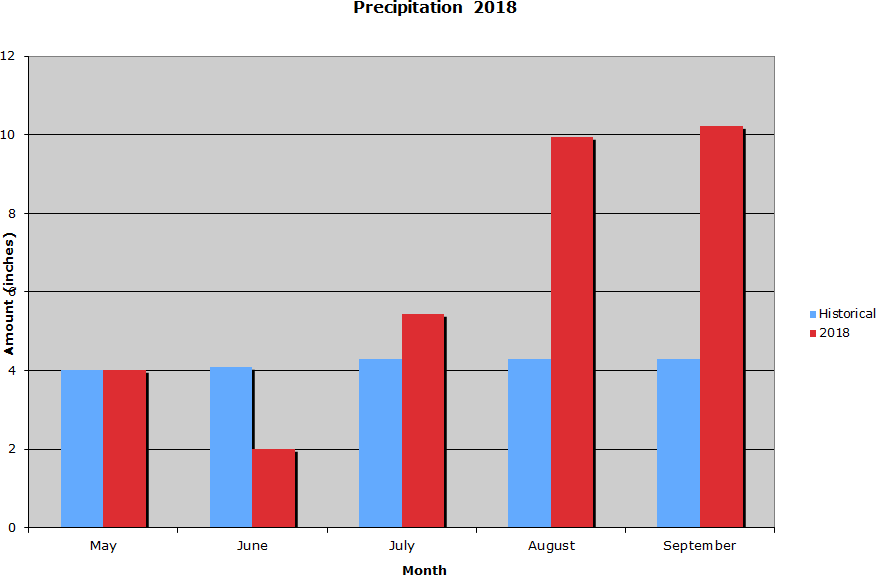
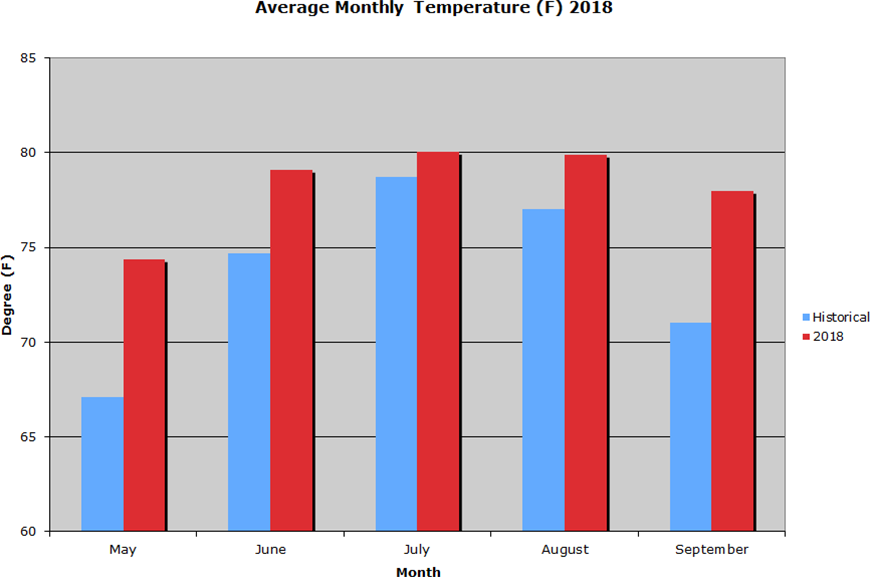
Our growing conditions this summer were warm, nothing record breaking, yet persistent heat. The rain was significant, but not record breaking. The precipitation was normal for May but very dry in June. July was slightly wetter than normal with August and September receiving more than twice the usual amount of rainfall.
We did not have any 100° days. We did have some big heat—it was hot. We had 56, 90°+ days with the warmest being 99° seen on June 19. Our longest stretch of 90°+ days occurred early in the season, from June 17 through June 25. Our greatest amount of rainfall, 4.5", occurred on August 20. In September, Hurricane Florence dropped over 7” of rainfall over a period of several days. Many of the plants didn't survive the saturated soils and of those that did survive the high heat that followed negatively impacted many.
Variance
Variance: The Best of Uniformity
Sometimes I think that the one number most often overlooked in our report is the variance. Go to the "Leaders of the Pack" data tables and look for its column. The term itself may be intimidating in light of its mystery, but need not be as it can be most informative. Simply put, the lower the variance, the most alike all plants are in the group evaluated, and hence the greater the uniformity. For so many in the commercial landscaping sector, they live and die by uniformity because appearance can be everything. So, by using a selected variance value of 0.1 as our very tough cut-off, we can really see which plants are setting the standard for superb uniformity. In many cases our results have confirmed some excellent reputations, for others, it's a first time notice.
Variance: All Over the Page
Whereas small variance values indicate excellent uniformity, the opposite can point out cultivars with a "mind of their own!" They are not necessarily a poor choice, just not ruler perfect. In this case, plants with variance values of 1.0 or more were highlighted for great differences observed during the season. To be fair, there are many reasons for a lack of uniformity, most likely of which would simply be the result of our normal or extreme weather.
Seed and Plant Material Sources
Please get in touch with these companies if you have specific questions regarding individual species and cultivars.
Seed and Plant Material Sources
All-America Selections, 5201 Walnut Avenue, Suite 3, Downers Grove, IL 60515
American Takii, 301 Natividad Road, Salinas, CA 93906
Ball FloraPlant, 622 Town Road, West Chicago, IL 63185
Ball Ingenuity, P.O. Box 335, West Chicago, IL 60185
Beekenkamp Plants, 403 Chestnut Lane, Faribault, MN 55021
Dümmen Orange, 15245 West Telegraph, Santa Paula, CA 93060
PanAmerican Seed, P.O. Box 335, West Chicago, IL 60185
Proven Winners, 1021 River Ridge Lane, Saint Thomas, MO 65076
Selecta First Class, P.O. Box 335, West Chicago, IL 60185